- Liquidity Natural Gas Daily
- Posts
- Natural Gas Update 6-20-2025
Overview
NG spot futures are now down 3.5 cents
NG spot futures rose this morning to the highest price since April 4th as record heat is set to invade the East Coast of the U.S.
A brutal heat wave is in the forecast across the eastern United States, and it's expected to bring several days of record high temperatures at the start of the weekend and into next week. The National Weather Service has called it "the first significant heat wave this season." Temperatures are expected to soar more than 25-35 degrees above average in the Plains on Friday, CBS News reports. Potential daily record highs are also forecast for parts of the Rockies and Plains on Friday and Saturday, then temperatures well into the 90s will reach the mid-Atlantic and Northeast and linger into next week, CBS News adds. "Triple-digit heat indices will be common through next week, with oppressive humidity.", as per the National Weather Service.
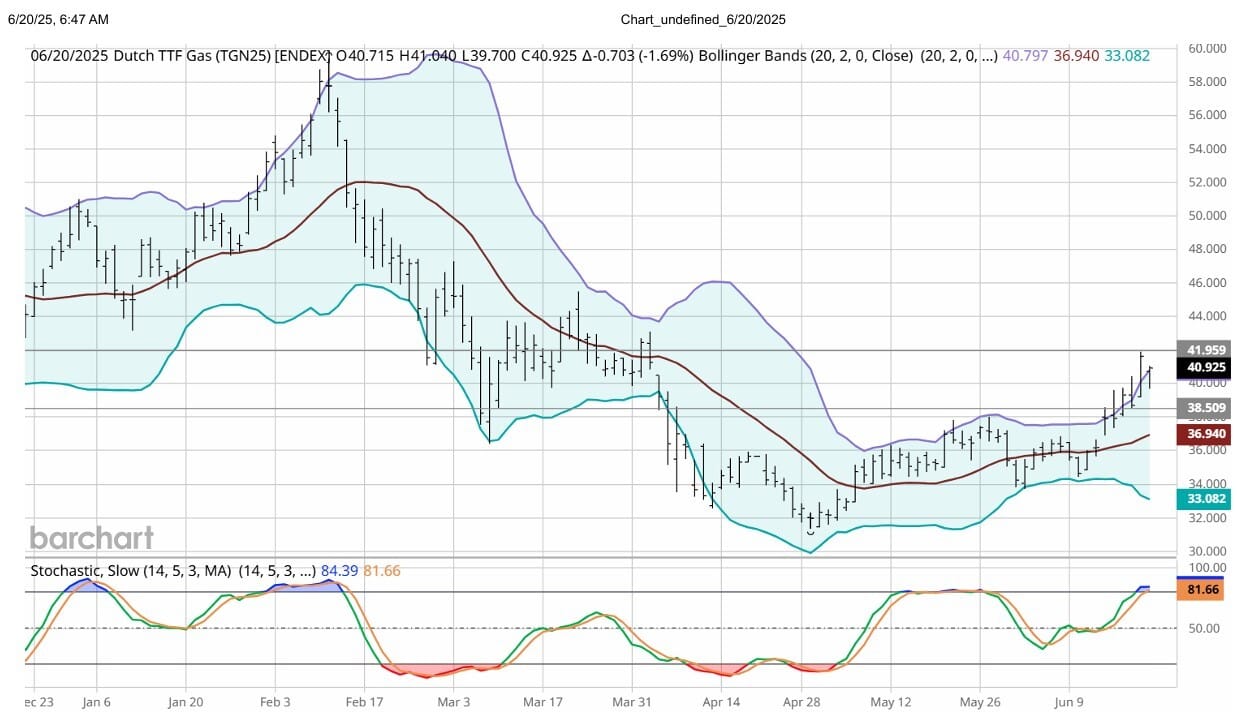
On Thursday, TTF spot futures rose to their best value since April 2nd. The DC chart gap that existed from 40.500 to 40.840 was filled with Thursday's being Euro 41.900. Prices have fallen back as fears of an escalation of Mideast tension have eased. "Most of the price rally is risk premium driven, but lower Norwegian flows due to seasonal maintenance is also forcing additional spot LNG purchases which adds to the price pressure,” analysts at DNB say. However, they note LNG imports remain significantly higher year-on-year and are sufficient to balance the market and refill inventories. (WSJ) Technically the chart shows the spot TTF futures contract having tested the upper bollinger band for the 6th straight session. The momentum looks to be cresting and poised to turn lower.
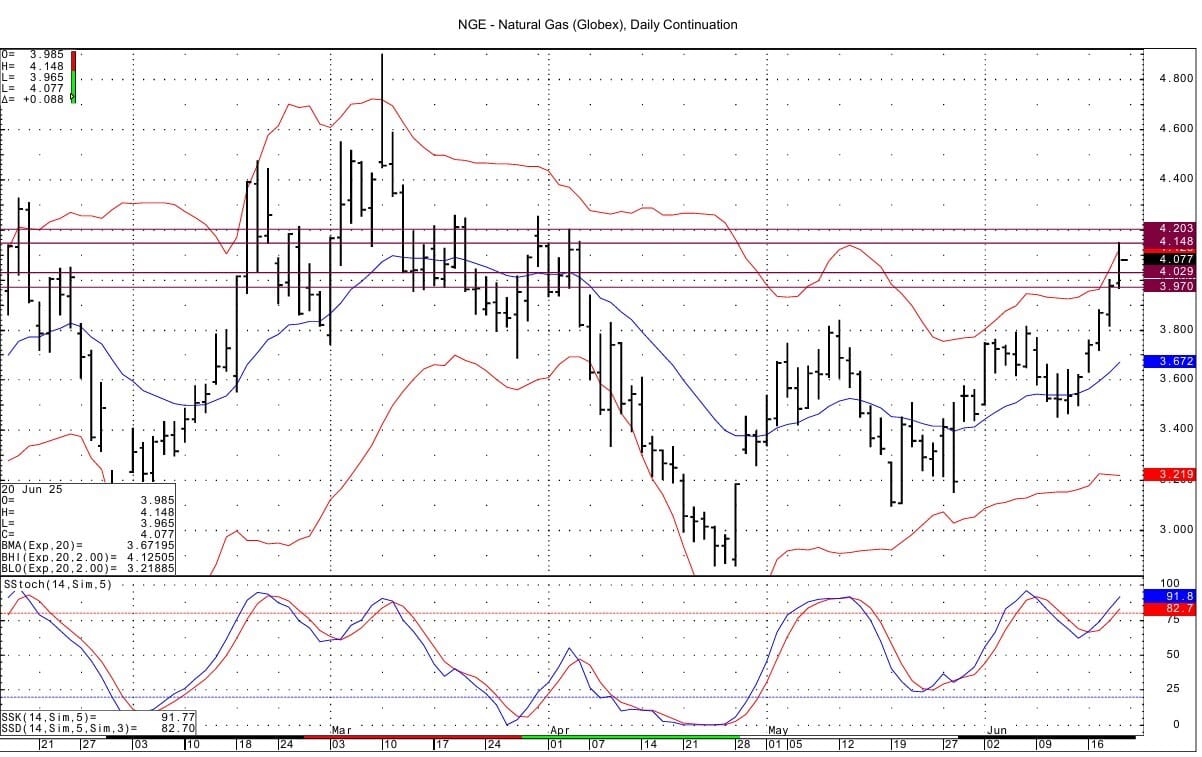
Technically, spot NG futures resistance at 4.141-4.148 has been tested today with a high of 4.148. Above that resistance lies at 4.201-4.203. Support is seen at 4.029-4.034 and then at the low of the 2 day session at 3.965-3.970. The upper bollinger band on the DC chart has been tested today. That band lies currently at 4.125.
Enjoyed this article?
Subscribe to never miss an issue. Daily updates provide a comprehensive analysis of both the fundamentals and technical factors driving energy markets.

Click below to view our other newsletters on our website:
Disclaimer
This article and its contents are provided for informational purposes only and are not intended as an offer or solicitation for the purchase or sale of any commodity, futures contract, option contract, or other transaction. Although any statements of fact have been obtained from and are based on sources that the Firm believes to be reliable, we do not guarantee their accuracy, and any such information may be incomplete or condensed.
Commodity trading involves risks, and you should fully understand those risks prior to trading. Liquidity Energy LLC and its affiliates assume no liability for the use of any information contained herein. Neither the information nor any opinion expressed shall be construed as an offer to buy or sell any futures or options on futures contracts. Information contained herein was obtained from sources believed to be reliable, but is not guaranteed as to its accuracy. Any opinions expressed herein are subject to change without notice, are that of the individual, and not necessarily the opinion of Liquidity Energy LLC
Reply