- Liquidity Natural Gas Daily
- Posts
- Natural Gas Update 6-23-2025
Overview
Natural Gas---July NG is down 1.9 cents
Natural gas prices are slightly lower this morning after rallying overnight on the back of the heightened Mideast tension and the current heat wave invading the Eastern U.S. But, temperatures are seen retreating to normal in the forecast.
Cities along the U.S. Eastern coast are to see temperatures of 100 degrees today, with heat indices raising the temperatures to 105-110 degrees. Yet, some of the powerburn for natural gas seen this weekend was displaced by stronger wind generation, as per Celsius Energy reporting. The heat wave is seen lasting for 3-4 days. But, the sharp pullback in prices seen since Friday is attributed to a return to normal temperatures after the current heat wave. The Commodity Weather Group on Friday said mostly normal temperatures are expected across the eastern two-thirds of the U.S. for June 30-July 4.
U.S. domestic natural gas production was estimated at 108.2 BCF/d on June 21 compared to the 30 day average of 106.46 BCF/d, according to Bloomberg data.
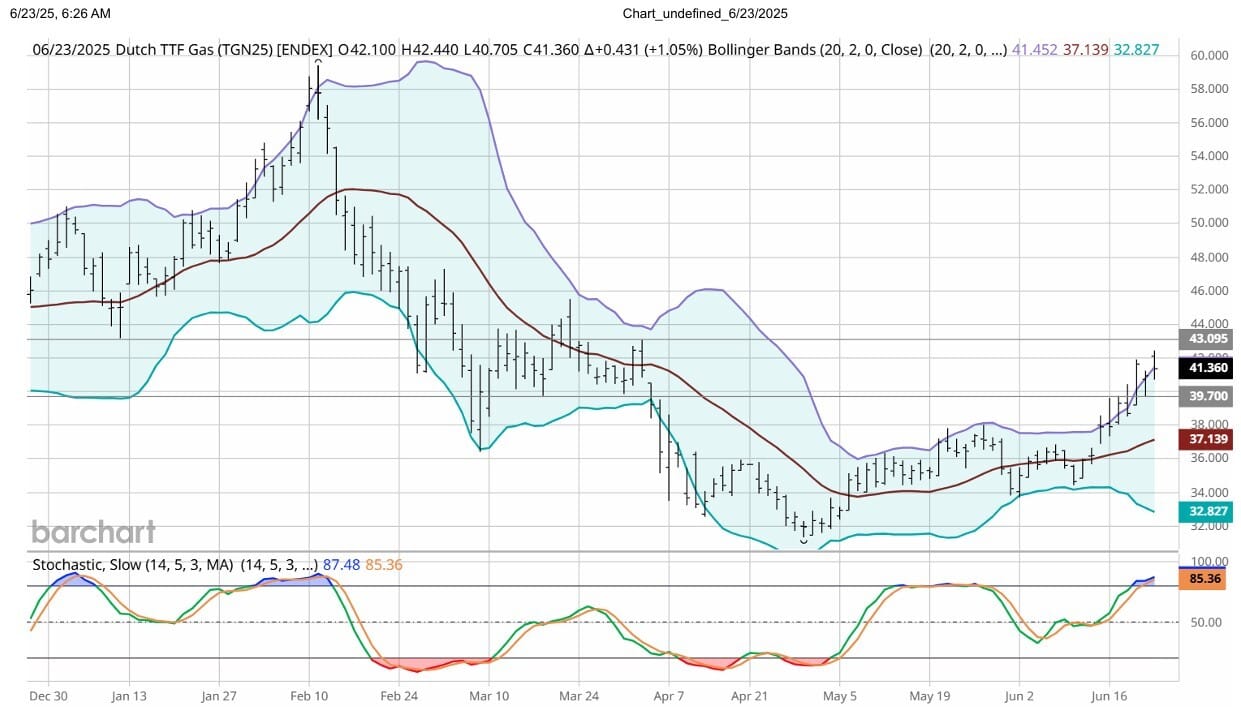
TTF futures prices in Europe rose today to a fresh high since April 2nd on the Mideast tension. Technically the contract still has positive momentum that is not yet overbought. But, the contract continues to bump against the DC chart's upper bollinger band. Resistance for the spot futures is seen near 43 Euro and support near 39.7 Euro/Mwh.
Early estimates for this week's EIA gas storage data are seen as a build of 85 to 86 BCF. This compares to last year's build of 59 BCF and the 5 year average build of 79 BCF.
The Baker Hughes gas rig count seen Friday showed a decrease of 2 units.
A notable option trade from CME activity from Friday saw the September $5.00 call sold versus buying of the $3.50 put for a cost to the put buyer of 1.8 cents. There were delta September futures bought at $4.40 in the trade.
Technically, spot NG futures were repelled Friday from a test of the DC cart upper bollinger band and from resistance at the 4.141-4.148 area. In fact, currently prices over $4 seem unsustainable. Resistance is seen at the overnight high at 3.949-3.955 and then at 4.012-4.017. Support at 3.814-3.818, has been tested this morning. Below that next support comes in at 3.719-3.720. Momentum looks to be cresting, suggesting a turn downward.

Enjoyed this article?
Subscribe to never miss an issue. Daily updates provide a comprehensive analysis of both the fundamentals and technical factors driving energy markets.

Click below to view our other newsletters on our website:
Disclaimer
This article and its contents are provided for informational purposes only and are not intended as an offer or solicitation for the purchase or sale of any commodity, futures contract, option contract, or other transaction. Although any statements of fact have been obtained from and are based on sources that the Firm believes to be reliable, we do not guarantee their accuracy, and any such information may be incomplete or condensed.
Commodity trading involves risks, and you should fully understand those risks prior to trading. Liquidity Energy LLC and its affiliates assume no liability for the use of any information contained herein. Neither the information nor any opinion expressed shall be construed as an offer to buy or sell any futures or options on futures contracts. Information contained herein was obtained from sources believed to be reliable, but is not guaranteed as to its accuracy. Any opinions expressed herein are subject to change without notice, are that of the individual, and not necessarily the opinion of Liquidity Energy LLC
Reply