- Liquidity Natural Gas Daily
- Posts
- Natural Gas Update December 9,2025
In partnership with
June 23, 2026
Overview
Natural Gas--NG is down 19.3 cents at $4.719
NG futures have fallen further after Monday's sharp fall as weather forecasts dialed back some late December demand. Storage withdrawals remain strong, as are LNG export volumes. NGI commentary today cites a "widespread thawing in the second half of December."
Meteorologists forecast weather across the country would remain mostly near normal through December 23. (Reuters) Forecaster Atmospheric G2 said that the forecast shifted slightly colder over the eastern and southern US for December 18-22, but noticeably warmer elsewhere. Also, other weather models support a broad-scale warmer risk as cold air is confined to Canada. (Barchart)
Financial firm LSEG said average gas output in the Lower 48 states rose to 109.7 BCF/d so far in December, up from a monthly record high of 109.6 BCF/d in November.
Average gas flows to the eight large LNG export plants in the U.S. rose to 18.9 BCF/d so far this month, up from a monthly record high of 18.2 BCF/d in November. NGI data shows LNG export feed gas volume Monday stood at 19.39 BCF/d, in line with the prior 4 days. The record volume of 19.53 BCF/d was set on Thursday and Friday of last week.
On Monday, LSEG projected average gas demand in the Lower 48 states, including exports, would rise from 143.8 BCF/d this week to 146.0 BCF/d next week. These forecasts are up 5.0 BCF/d total from those seen Friday.
Gas inventories in storage have seen the surplus to the 5 year average cut in half over the past 2 weeks, as per Celsius Energy data. They see the surplus falling further to 25 BCF. Last week's EIA data had the surplus at 191 BCF/5.12%. But, one investor said: "inventories remain 5% above the five-year average and that does not usually justify prices with a mid-$5 handle." Celsius Energy sees inventories having fallen Monday below 3.7 TCF. Last week's EIA data had inventories at 3.923 TCF. Celsius says that the fall below 3.7 TCF has happened 7 days later than the 5 year average of December 1, but earlier by one day than last year when it fell below 3.7 TCF on December 9th.
Options activity of note from the CME from Monday shows the January February CSO 50 cent / $1.00 call spread having traded 5.3 cents. Additionally, the January February $1.00 call traded against the $1.50 call at a cost of 1.8 cents. Also in the January February CSO, the 40 cent/50 cent call spread traded 2.8 cents. The January $5.50 call saw a large open interest increase; among the trades seen in that strike were the $5.25/$5.50/$5.75 call butterfly having traded 1.8 cents cost to the buyer of the wings. The March April CSO 25 / 50/ 75 cent call butterfly traded 5,000 contracts worth at a cost of 1.5 cents to the buyer of the wings. The trade was being initiated as per CME open interest data. 2,000 contracts of the March April flat/-5 cent put spread traded 2.3 cents. The March April futures spread settled Monday at 11.2 cents.
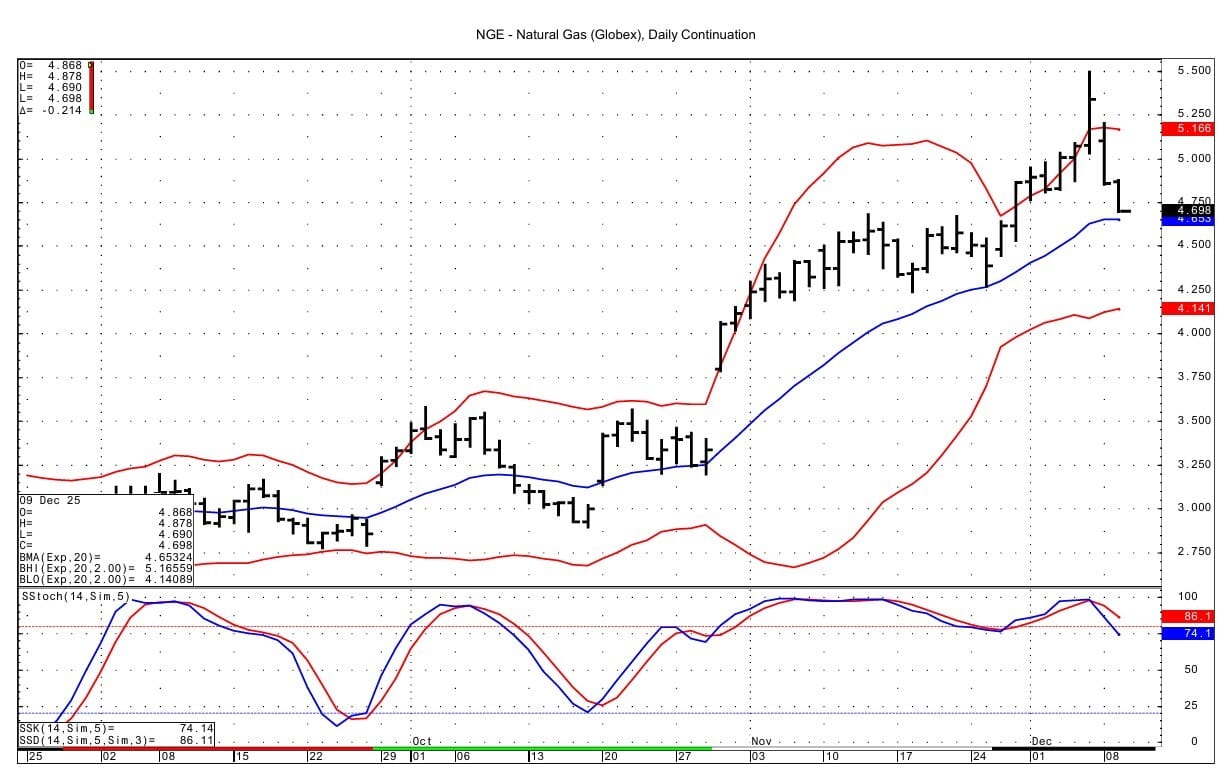
Technically, Monday the spot NG futures settled down 7.13% from Friday. Some of the fall may have been a function of the index funds rolling longs from January to March as the open interest on the CME shows a drop of 23,628 contracts in January futures and an increase of 15,132 contracts in the March 2026 contract.
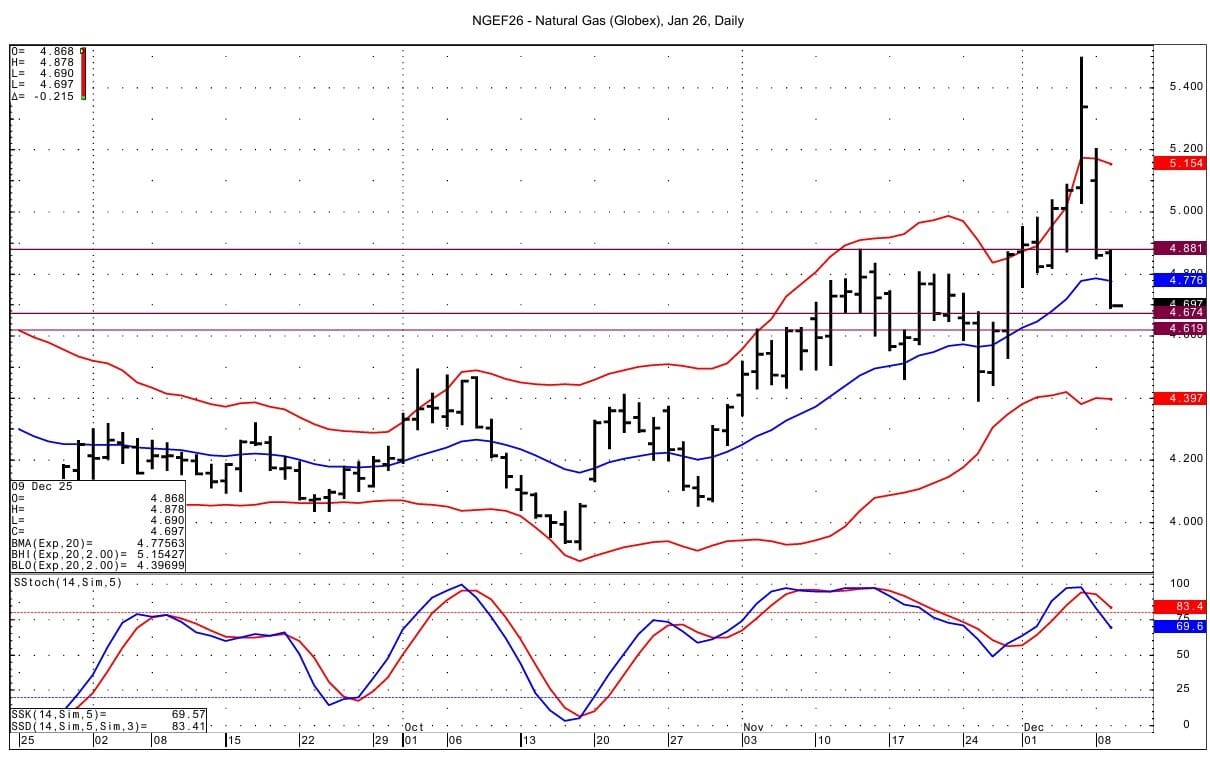
Support for the spot NG futures at 4.750-4.758 has been broken. Below that support lies at 4.674-4.677. Resistance comes in at 4.874-4.881, which was tested with the overnight high of 4.878. Above that resistance is seen at 4.51-4.952. Momentum is negative basis the DC chart.
Enjoyed this article?
Subscribe to never miss an issue. Daily updates provide a comprehensive analysis of both the fundamentals and technical factors driving energy markets.

Click below to view our other newsletters on our website:
Disclaimer
This article and its contents are provided for informational purposes only and are not intended as an offer or solicitation for the purchase or sale of any commodity, futures contract, option contract, or other transaction. Although any statements of fact have been obtained from and are based on sources that the Firm believes to be reliable, we do not guarantee their accuracy, and any such information may be incomplete or condensed.
Commodity trading involves risks, and you should fully understand those risks prior to trading. Liquidity Energy LLC and its affiliates assume no liability for the use of any information contained herein. Neither the information nor any opinion expressed shall be construed as an offer to buy or sell any futures or options on futures contracts. Information contained herein was obtained from sources believed to be reliable, but is not guaranteed as to its accuracy. Any opinions expressed herein are subject to change without notice, are that of the individual, and not necessarily the opinion of Liquidity Energy LLC
Learn how to make every AI investment count.

Successful AI transformation starts with deeply understanding your organization’s most critical use cases. We recommend this practical guide from You.com that walks through a proven framework to identify, prioritize, and document high-value AI opportunities.
In this AI Use Case Discovery Guide, you’ll learn how to:
Map internal workflows and customer journeys to pinpoint where AI can drive measurable ROI
Ask the right questions when it comes to AI use cases
Align cross-functional teams and stakeholders for a unified, scalable approach
Reply