- Liquidity Natural Gas Daily
- Posts
- Natural Gas Update March 16,2026
July 30, 2026
Overview
Natural Gas--NG is down 3.3 cents at $3.098
NG spot futures are lower now after having started the overnight session higher on the back of Iran conflict concerns; but, the lack of a bullish weather pattern in the US is providing headwinds as weather forecasts are calling for milder weather later this week.
NatGasWeather is calling for the next 3 days to show high natural gas demand, but demand will turn to low for days 4 through 7 and then days 8 through 15 are set to show demand that is moderate to low.
The Henry Hub (HH) next day cash gas price averaged $3.185/MMBtu on Friday, according to NGI’s MidDay Alert, down from $3.295 on Monday. On Thursday, the HH price was $3.26/$3.28. The HH cash continued Friday to hold a 5 cent premium to the spot NG futures. The trend of lower HH prices seen last week may continue in the coming days thanks to planned maintenance on a critical pipeline serving Sabine Pass LNG, as per NGI commentary.
Money managers reduced their net short position in futures/options on the CME by 13,335 contracts in the week ended Tuesday March 10. This lowered their net short total to 62,574 contracts.
European TTF natural gas futures prices are up slightly today, but remain in the trading range seen the past few sessions. WSJ commentary reads a follows: "“Despite war-related disruptions and many cargoes being diverted to Asia, Europe remains well supplied for now, with steady LNG flows and milder demand,” analysts at ANZ say. “However, competition for cargo with Asia is expected to intensify later in the summer.” Meanwhile, traders await more clarity after European Commission President Ursula von der Leyen said the EU is weighing subsidies or a cap on natural-gas prices to protect its citizens. Narrow LNG-to-TTF spreads in Europe are reducing incentives to import LNG and regasify it for sale into the gas market, Platts said.
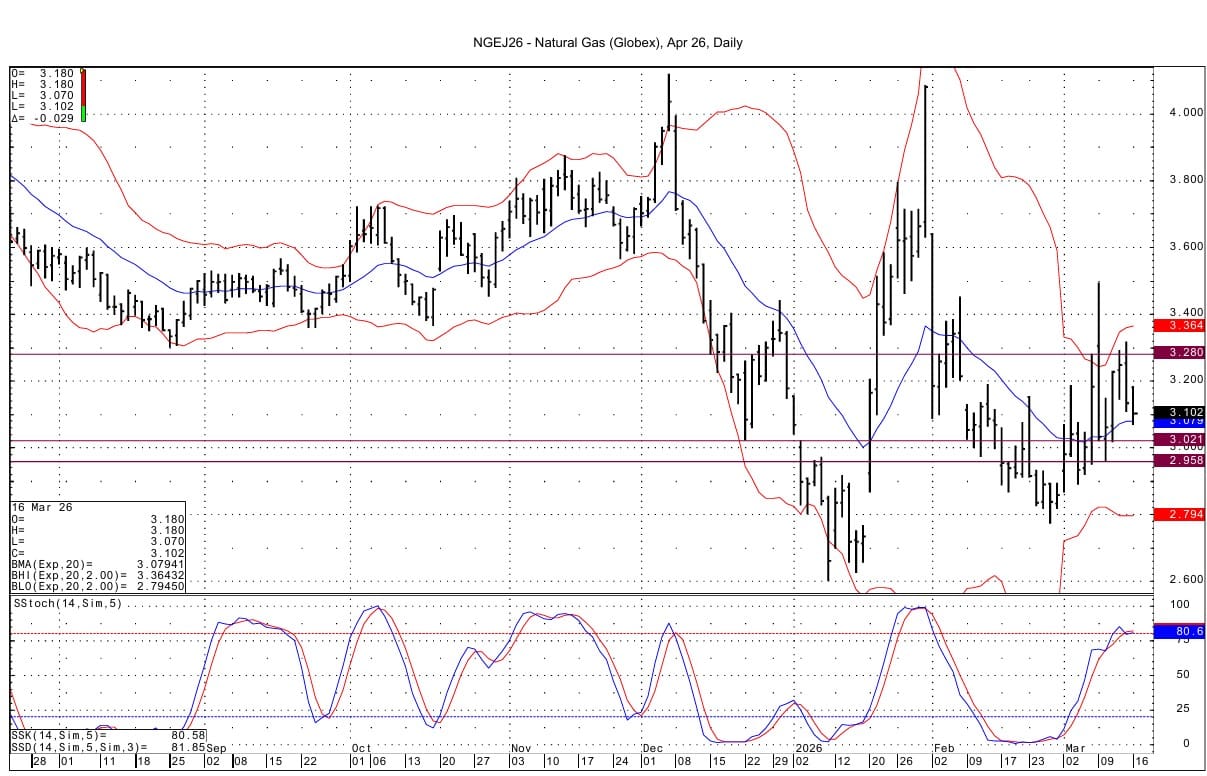
Technically, the NG futures remain mired in the trading range seen in recent weeks. Momentum has a slight negative downward look on the April daily chart. Support below is seen at 3.019-3.021 and then at 2.958-2.962. Resistance is seen at 3.275-3.280.
Enjoyed this article?
Subscribe to never miss an issue. Daily updates provide a comprehensive analysis of both the fundamentals and technical factors driving energy markets.

Click below to view our other newsletters on our website:
Disclaimer
This article and its contents are provided for informational purposes only and are not intended as an offer or solicitation for the purchase or sale of any commodity, futures contract, option contract, or other transaction. Although any statements of fact have been obtained from and are based on sources that the Firm believes to be reliable, we do not guarantee their accuracy, and any such information may be incomplete or condensed.
Commodity trading involves risks, and you should fully understand those risks prior to trading. Liquidity Energy LLC and its affiliates assume no liability for the use of any information contained herein. Neither the information nor any opinion expressed shall be construed as an offer to buy or sell any futures or options on futures contracts. Information contained herein was obtained from sources believed to be reliable, but is not guaranteed as to its accuracy. Any opinions expressed herein are subject to change without notice, are that of the individual, and not necessarily the opinion of Liquidity Energy LLC
Reply