- Liquidity Natural Gas Daily
- Posts
- Natural Gas Update March 31,2026
July 7, 2026
Overview
Natural Gas --NG is up 8.0 cents at $2.967
NG futures have turned positive as the latest weather run saw HDD demand rise quite a bit.
In the latest 11 to 14 day Lower 48 states weather run, the HDD count added some heating demand, practically doubling from 19.93 HDD to 41.01 HDD, thus putting it now in line with the ten-year average, as per Market News reporting. Yesterday, Celsius Energy said that the forecast was about as bearish as it can get for the first two weeks of the injection season with forecast GWDDs for March 30-April 12 at just 151 GWDDs, by far the fewest for the period in the last 5 years. The prior 5 year average GWDD for the period is 212. Reflecting the weak demand, NGI’s Spot Gas National Average price fell Monday by 21.5 cents to $1.645/MMBtu.
NGI says that the natural gas power burn has risen to be in line with year to date levels versus a year ago as low prices are "giving the fuel a competitive boost even as the mildest March weather in 14 years suppressed broader demand."
As we come up upon the beginning of injection season, the NG market will now shift its focus to the end of season / end October gas storage levels. Celsius Energy writes: " My end-of-season storage maximum projection currently stands at 3.730 TCF for November 13, 72 BCF bullish versus the 5 year average & the third lowest season-ending maximum in the last 5 years. It would represent a 125 BCF improvement from the current surplus. The Desk sees the end of October 2026 storage level being at 3.907 TCF. This month's STEO by the EIA forecasted EOS October 2026 to be at 3.971 TCF.
This week's EIA gas storage data is seen as a build of 30 to 38 BCF, as per early estimates. That compares to last year's build of 30 BCF and the 5 year average which is a draw of 4 BCF. NGI points out that HDD demand fell during the reporting period thus putting a damper on gas-fired power production.
LNG feedgas demand figures are expected to rise significantly in the weeks ahead, following news that Golden Pass has achieved first LNG. Kpler data suggest an LNG vessel is estimated to arrive at Golden Pass on or near April 28. (NGI)
The EU gas storage was at 28.14% full as of March 28 (versus the 5-year average of 40.9%), as per Gas Infrastructure Europe data. Analysts at ING warn that prolonged LNG supply disruptions could slow the pace of injections into European storage and intensify competition for spot LNG cargoes, particularly at a time when the ability to increase or redirect global supply is limited.
China’s LNG imports are on track to fall below 4 million metric tons in March for a second straight month, which would mark the weakest monthly intake in roughly eight years, according to Vortexa. The main reason is price. Asian spot LNG has surged above $20/MMBtu since the US-Iran conflict began, while China’s domestic trucked LNG prices have risen far less to around $15/MMBtu. China is seen entering the shoulder season with comfortable supply from domestic production and pipeline imports. They have thus re-exported spot LNG cargoes and sold them to South Korea, Thailand, Japan and the Philippines. (Market News)
Open interest data from Monday from the CME shows a rise of 14,191 contracts in NG futures, which we see as mostly new short positions. These were in the May, June, October and November contracts. Further open interest data from the LN options on the CME show new positions in the September November CSO. The minus 30 cent call was sold against buying of the minus 50 cent put at a cost of 2.5/2.6 cents. A total of 5,000 contracts traded. The September November futures spread settled Monday at minus 39.5 cents. Additionally open interest fell in the October January CSO -$1.00 and -$0.75 call options. The -$1.00 call was bought against selling of the -$0.75 call at a cost of 3.9 and 4.0 cents.
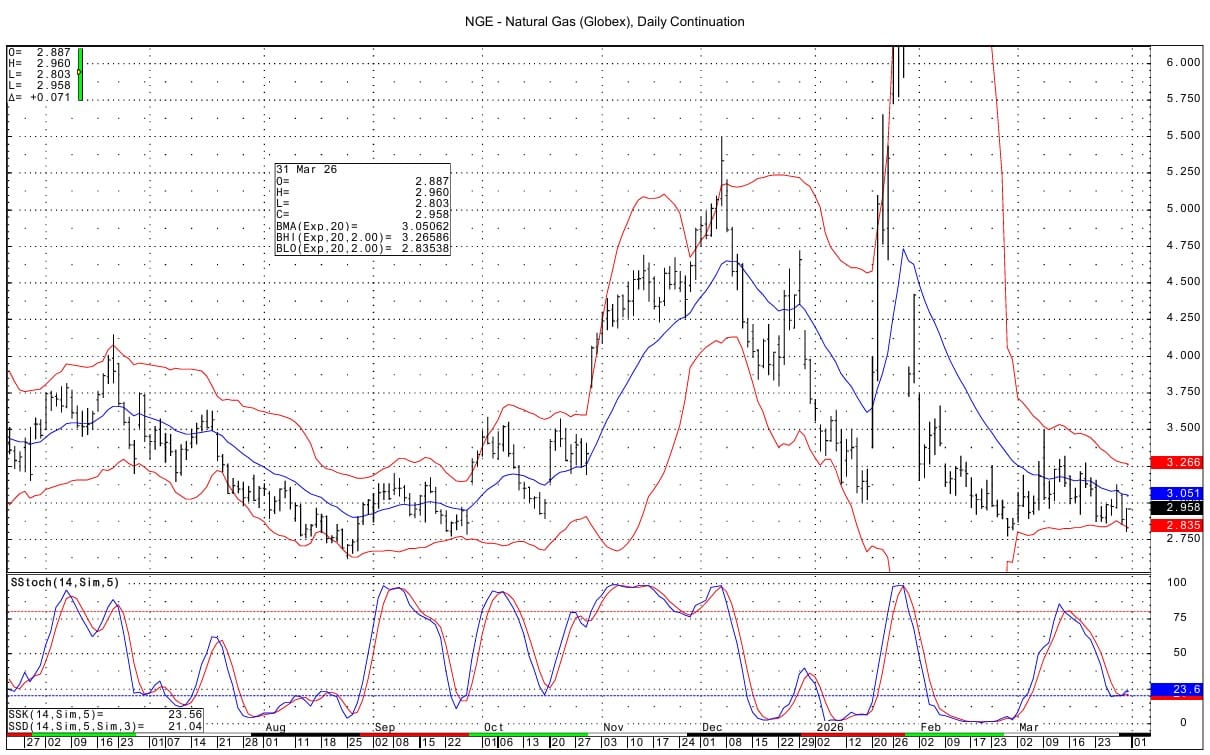
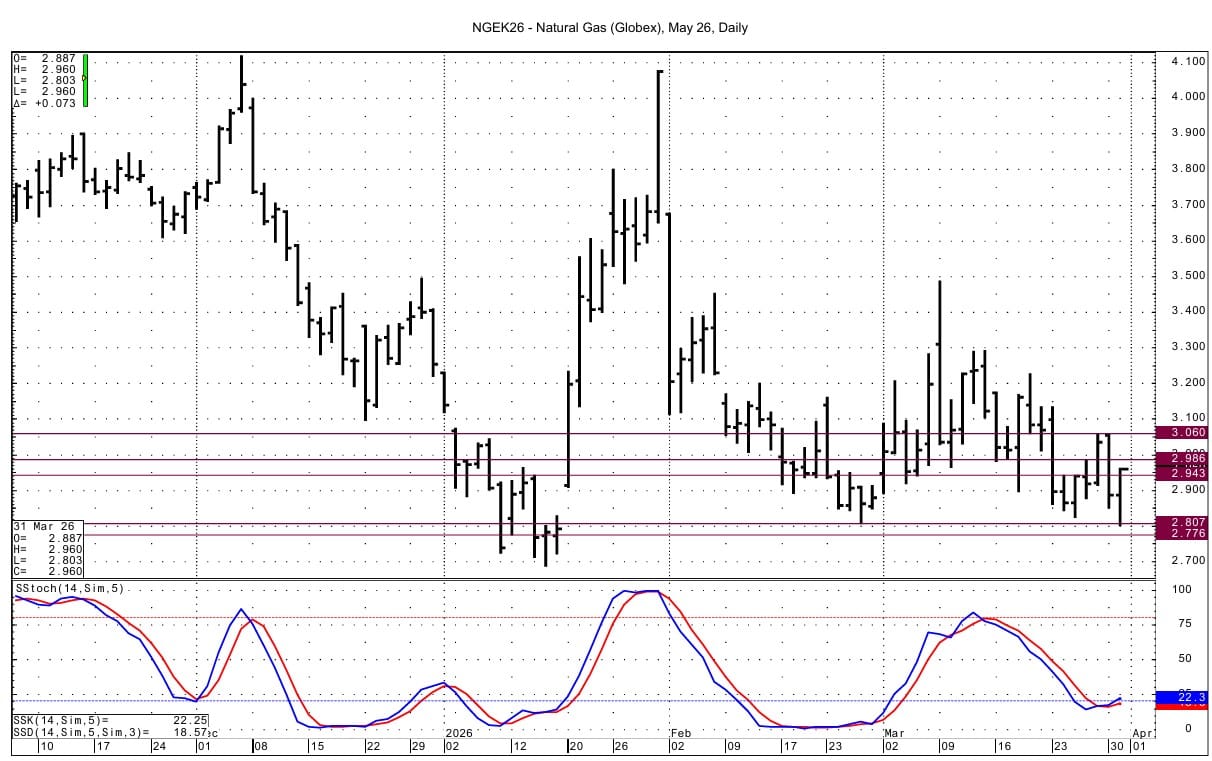
Technically, momentum has turned positive for the NG basis both the DC and May daily charts with this morning's rally. The overnight selloff tested support at $2.807 with a low of $2.803. The DC chart's lower bollinger band was also tested; that band intersects at $2.835. Below $2.80, support lies at 2.776. Resistance at 2.943 has been pierced. Above that resistance is seen at 2.981-2.986 and then at the double top from Friday/Monday at 3.057-3.060.
Enjoyed this article?
Subscribe to never miss an issue. Daily updates provide a comprehensive analysis of both the fundamentals and technical factors driving energy markets.

Click below to view our other newsletters on our website:
Disclaimer
This article and its contents are provided for informational purposes only and are not intended as an offer or solicitation for the purchase or sale of any commodity, futures contract, option contract, or other transaction. Although any statements of fact have been obtained from and are based on sources that the Firm believes to be reliable, we do not guarantee their accuracy, and any such information may be incomplete or condensed.
Commodity trading involves risks, and you should fully understand those risks prior to trading. Liquidity Energy LLC and its affiliates assume no liability for the use of any information contained herein. Neither the information nor any opinion expressed shall be construed as an offer to buy or sell any futures or options on futures contracts. Information contained herein was obtained from sources believed to be reliable, but is not guaranteed as to its accuracy. Any opinions expressed herein are subject to change without notice, are that of the individual, and not necessarily the opinion of Liquidity Energy LLC
Reply