- Liquidity Natural Gas Daily
- Posts
- Natural Gas Update November 7,2025
Natural Gas Update November 7,2025
Liquidity Energy, LLC
December 23, 2025
Overview
Natural Gas--NG is down 6.1 cents at $4.296
NG futures are lower now after rising the past 24 hours to their best value since March 11th in a late day rally Thursday and overnight. Various reasons were given for the rally. A cold snap in the Eastern half of the US over the coming days underpinned the front end of the curve. The small storage increase in the EIA report is seen underscoring that heating season had begun. The backdrop of near record LNG demand also helped it seems. We see the rally having been also a function of short covering.
NG demand could jump as much as 18 BCF/d from Friday to Monday, one analyst said. An Arctic front will reinforce the first system moving through the East with a snowy mix to hit the Midwest, while Texas is set to see record highs Saturday with temperatures 10-20 degrees above normal. Temperatures will drop over Texas on Sunday after the Arctic front sweeps through. (NOAA.gov) The EIA gas storage report indicated to one analyst that "The report week saw the most significant heating load so far this fall as temperatures are cooling quickly at this point in the season. " But, the analyst added :" "this will very likely not be the final net build of the year." (WSJ) Forecaster Atmospheric G2 said Thursday that forecasts shifted colder over the eastern US for November 11-15.
The EIA gas storage data issued Thursday was in line with expectations. The build was 33 BCF, which was the smallest build since August. This was the first report since early September to see the current inventories at a level below that of a year ago. While the natural gas storage level this year is now below the level of 1 year ago ( by 6 BCF), the total current amount in storage of 3.915 TCF is at the upper end of the range seen since 2015, and remains 4.32 % above the 5 year average. And the calendar month of November is not one in which there is normally a large drawdown in natural gas inventories. The best drawdown since 2015 during the month of November was -152 BCF. There were in fact 4 years since 2015 in which storage rose during the calendar month of November. But, Celsius Energy offered a positive outlook on the report. The season-to-date build stands at +2142 BCF, dropping below 2022’s +2165 BCF for the 5-year high. This is the first time that the current season has not been at the 5-year high since the third week of the injection season back in April.
The Matterhorn Pipeline expansion out of the Permian basin is likely to ramp up soon. The pipeline transporting gas from the Permian to Katy is scheduled to bring a 0.5 BCF/d expansion online by year end. This will hopefully help bring Waha hub prices back to positive territory. The pipeline expansion will also hopefully ultimately help fuel the LNG demand increase being seen along the Gulf Coast.
Open interest in NG futures on the CME fell by 9,620 contracts in Thursday's trading. There were decreases in the December through March contracts. We see this as being a function of short covering, given we saw intraday trading volume on the CME spike during the late day rally, thus possibly having triggered stops.
The NG/LN options were active Thursday --especially in the 1 month Calendar Spread Options (CSO). 2,000 contracts of the March April 2027 CSO flat put traded 4.5 cents in a new position initiating trade. Also in the March April 2027 CSO, 4,000 of the minus 10 cent put traded 1.7 cents. The March April 2026 CSO was also active with 5,000 contracts of the 50 cent/$1.00/$1.50 call butterfly trading 1.7 cents. The March April 2026 $1/$2 call spread traded 3.75 cents; 3,000 contracts traded. In the Jan/Feb 1 month CSO, the 25 cent/$1.00 call spread traded 9.1 cents with the trade having additional sales of the 10 cent put at 3.5 cents; thus the total cost of the trade was 5.6 cents. The $15.00 February call traded 0.4 cents.
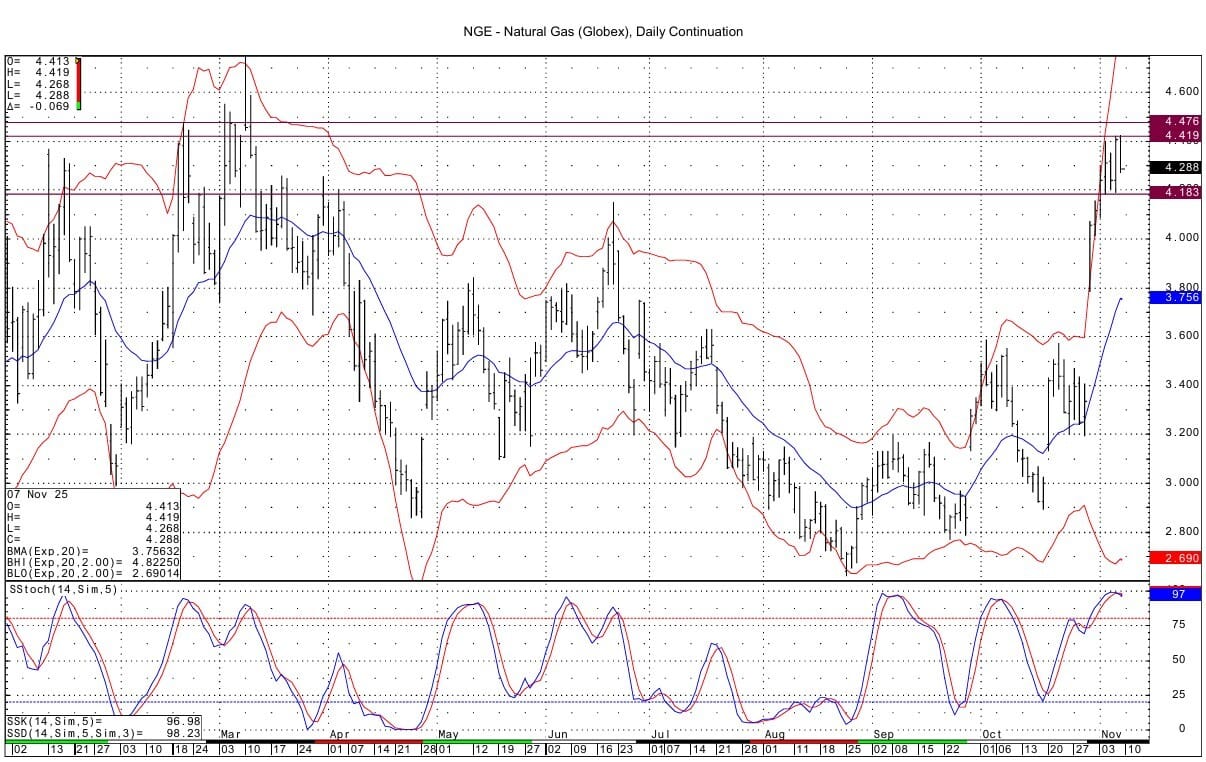
Technically there are 3 warning signals for the bulls at present : 1) there is a double top from yesterday/today at 4.420 / 4.419 (2) the RSI on the DC chart remains over 70 indicating an overbought condition (3) the DC chart momentum stochastic indicator is turning lower from an overbought level. Support below lies at the lows seen this week at 4.183-4.192. Resistance above the double top comes in at 4.471-4.476.

Enjoyed this article?
Subscribe to never miss an issue. Daily updates provide a comprehensive analysis of both the fundamentals and technical factors driving energy markets.
Click below to view our other newsletters on our website:

Disclaimer
This article and its contents are provided for informational purposes only and are not intended as an offer or solicitation for the purchase or sale of any commodity, futures contract, option contract, or other transaction. Although any statements of fact have been obtained from and are based on sources that the Firm believes to be reliable, we do not guarantee their accuracy, and any such information may be incomplete or condensed.
Commodity trading involves risks, and you should fully understand those risks prior to trading. Liquidity Energy LLC and its affiliates assume no liability for the use of any information contained herein. Neither the information nor any opinion expressed shall be construed as an offer to buy or sell any futures or options on futures contracts. Information contained herein was obtained from sources believed to be reliable, but is not guaranteed as to its accuracy. Any opinions expressed herein are subject to change without notice, are that of the individual, and not necessarily the opinion of Liquidity Energy LLC
Reply