- Liquidity Natural Gas Daily
- Posts
- Natural Gas Update October 2,2025
Overview
Natural Gas --NG is up 2.4 cents at $3.500
NG prices are up again today after the 5.24% rally seen Wednesday in the spot futures. The rally was said to be a function of short covering and the addition of heating demand. Strong cash pricing at the Henry Hub has also been a catalyst for the higher prices for futures.
WSJ commentary quoted a source on Wednesday saying that :"weather models have added as much as 17 heating-degree days." A cold front is forecast to move from the Midwest to the East, with cooler conditions late in the Oct. 6-10 period, according to Bloomberg.
Henry Hub next day cash is quoted this morning at $3.30/$3.340. This is up 17 to 19 cents from Tuesday's price and 11 to 12 cents versus yesterday's pricing. The cash futures differential today is about 12 to 16 cents with the November futures printing at $3.466 versus the 3.30/3.340 quote. The differential was at 17 cents yesterday and at 15 cents Tuesday.
Lower gas output has possibly helped fuel the rally as well. LSEG said average gas output in the Lower 48 states fell to 107.0 BCF/d so far in October, down from 107.4 BCF/d in September and a record monthly high of 108.3 BCF/d in August.
On Wednesday, LSEG projected average gas demand in the Lower 48 states, including exports, would slide from 101.4 BCF/d this week to 98.8 BCF/d next week. This week's demand estimate is down 1.5 BCF/d versus that seen last Friday.
The average amount of gas flowing to the eight big U.S. LNG export plants fell to a six-week low of 14.7 BCF/d so far in October, down from 15.8 BCF/d in September and a monthly record high of 16.0 BCF/d in April. The primary reason for the LNG export feedgas decline was a drop of 1.0 BCF/d from Tuesday to Wednesday in gas flows to Venture Global LNG's Calcasieu plant in Louisiana. (Reuters)
The EIA gas storage data to be released today is seen as a build of 64 to 70 BCF. This compares to last year's build of 54 BCF and the 5 year average build of 85 BCF.
Lower 48 states U.S. storage is on track to end the season at a two-year low of 3.869 TCF at the end of October, according to analyst estimates telling Reuters. The eight-year high was 3.938 TCF at the end of October 2024. The five-year average (2020-2024) is 3.782 TCF. The EIA's September STEO projected EOS gas inventories at 3.912 TCF. Earlier in the week, we had cited NGI's model projecting an EOS storage level of 3.935 TCF, which they said was down 20 BCF versus their prior week's estimate.
Yesterday, NG Option trading centered around the Nov 4.00 calls with 15,112 done and the Nov 3.00 puts with volume of 36,026. The November LN/NG put option open interest on the CME rose by over 22,000 contracts in Wednesday's trading. Notable was the rise in the $3.00 put strike. Among trades seen in that strike was it being sold versus buying of the $4.00 call for a cost of 1.1 cents to the call buyer, with .34 delta November futures sold at $3.46. Additionally, 1.5 of the $3.00 puts were sold against buying of one of the $3.50 puts at a cost of 16.6 cents, with .26 delta November futures buys at $3.44. Thirdly, the November $3.00 put was purchased at a cost of 6.2 cents with .2 delta futures purchases at $3.35. In the January/February 1 month CSO, the 50 cent call was bought versus selling of the 75 cent call at a cost of 1.9 cents. The January February 1 month 50 cent call was also sold versus buying of the 25 cent call at a cost of 4.5 cents to the lower strike buyer. The January/February spread settled 21.5 cents Wednesday.
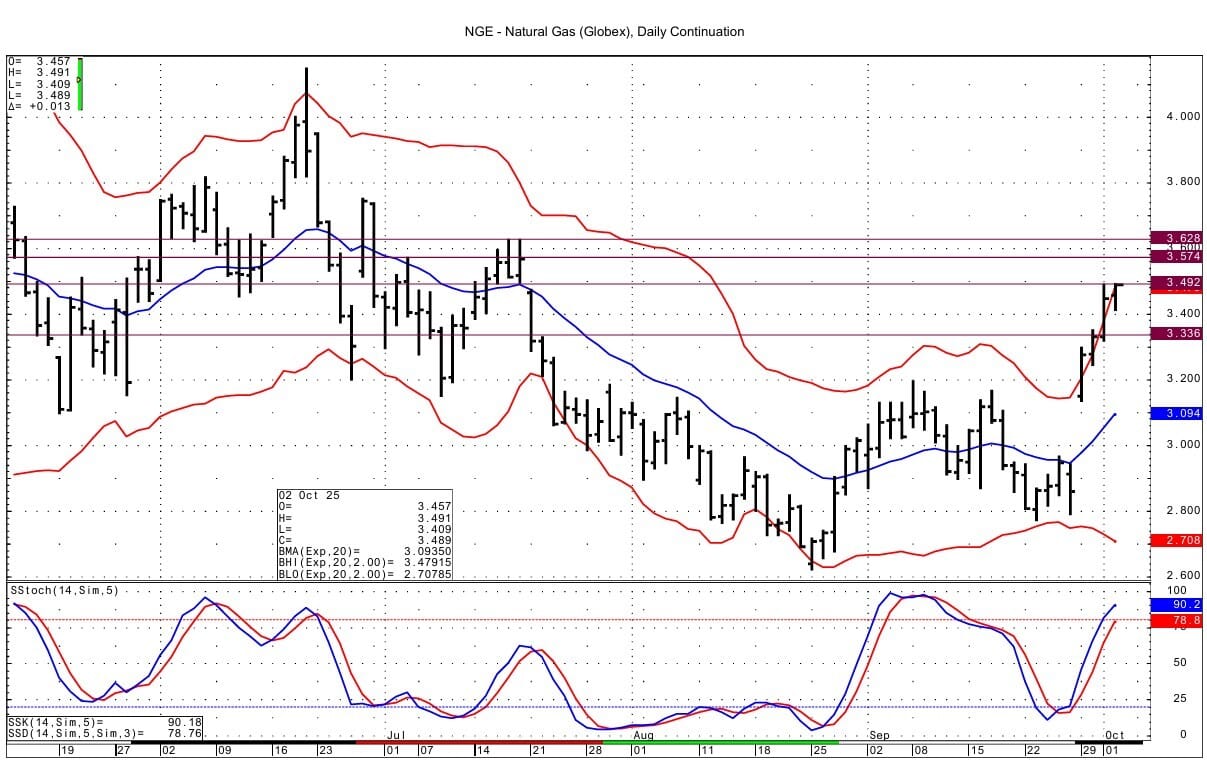
Momentum remains positive and not yet overbought for the NG futures basis the DC chart, that we see. Reuters commentary from Wednesday ,though, said: "the front-month is in technically overbought territory for a third day in a row for the first time since February." The gap on the DC chart going back to the low from July 18th of 3.494 has been filled this morning. Above this resistance comes in at 3.574-3.576 and then at 3.623-3.629. Support is seen at 3.335-3.340.
Enjoyed this article?
Subscribe to never miss an issue. Daily updates provide a comprehensive analysis of both the fundamentals and technical factors driving energy markets.

Click below to view our other newsletters on our website:
Disclaimer
This article and its contents are provided for informational purposes only and are not intended as an offer or solicitation for the purchase or sale of any commodity, futures contract, option contract, or other transaction. Although any statements of fact have been obtained from and are based on sources that the Firm believes to be reliable, we do not guarantee their accuracy, and any such information may be incomplete or condensed.
Commodity trading involves risks, and you should fully understand those risks prior to trading. Liquidity Energy LLC and its affiliates assume no liability for the use of any information contained herein. Neither the information nor any opinion expressed shall be construed as an offer to buy or sell any futures or options on futures contracts. Information contained herein was obtained from sources believed to be reliable, but is not guaranteed as to its accuracy. Any opinions expressed herein are subject to change without notice, are that of the individual, and not necessarily the opinion of Liquidity Energy LLC
Reply