- Liquidity Natural Gas Daily
- Posts
- Natural Gas Update September 30,2025
Overview
Natural Gas--NG is up 1.0 cents at $3.277
NG futures are near unchanged now after a brief rally earlier this morning, which sought to continue Monday's gains, which were seen being a result of strong feed gas volumes for LNG export and some "seasonal buying", which looks to be reflected in the open interest increase seen on the CME in the winter strip from November through March.
Market News data had feedgas volume at 16.19 BCF/d Monday. They added that the feed gas volume to export plants peaked over the weekend at 16.35 BCF/d and that volumes had been over 16 BCF/d since September 24 versus volumes of 14.82 from " the prior week", they added.
WSJ commentary cited EBW analysis on Monday stating that the EIA gas storage will increase by 270 BCF from September 26 to October 16. Celsius Energy analysis has storage rising by 327 BCF in the coming 4 weeks reports for the weeks ending September 26 to October 16. Celsius, though, says that the surplus to the 5 year average would fall by 12 BCF in that 4 week period, but 39 BCF would be added to the surplus to last year. EBW added in their commentary that the market will be adequately supplied and the price impact will be limited. “The market can better withstand any early-season cold without seasonal storage adequacy fears,”.
NGI analysis sees this week's EIA gas storage building by 64 BCF. This compares to last year's build of 54 BCF and the 5 year average build of 85 BCF. NGI says that this week's number was supported by solar and wind output being down a combined 16% last week, thus increasing the gas power generation percentage by 4%, echoing the news we mentioned yesterday from Celsius Energy. NGI goes on to say that they project the end of season (EOS) storage to be at 3.935 TCF, which is down 20 BCF from their estimate from last week. The EIA, in their STEO, estimated EOS at 3.912 TCF.
The next day Henry Hub cash price on Monday at midday was $2.93/$2.95, which was up 5 to 6 cents versus Friday's early AM quote. With the October November futures spread having one out at expiration Friday at about -36 cents, the November value near $3.28 at midday versus the $2.93/$2.95 cash price was in line.
Temperatures in some major cities in Texas will be as high as 94 to 96 degrees in the coming week or so. Houston, Dallas and San Antonio will have highs over the next 7 to 8 days that are 5 to 10 degrees above normal.
On the CME in Monday's options, the open interest in the November puts rose by over 10,000 contracts. Notable is the increase in the $2.75 put. We saw it bought against the $2.50 put at a cost of 3.85 cents with a delta amount of November futures bought at $3.14. But, more so we saw the November $2.75 put sold in a butterfly trade. The November $3.00 put was bought against selling of 3 of the $2.75 puts and buying 2 of the $2.55 puts at a total cost of the butterfly of 1.6 cents.
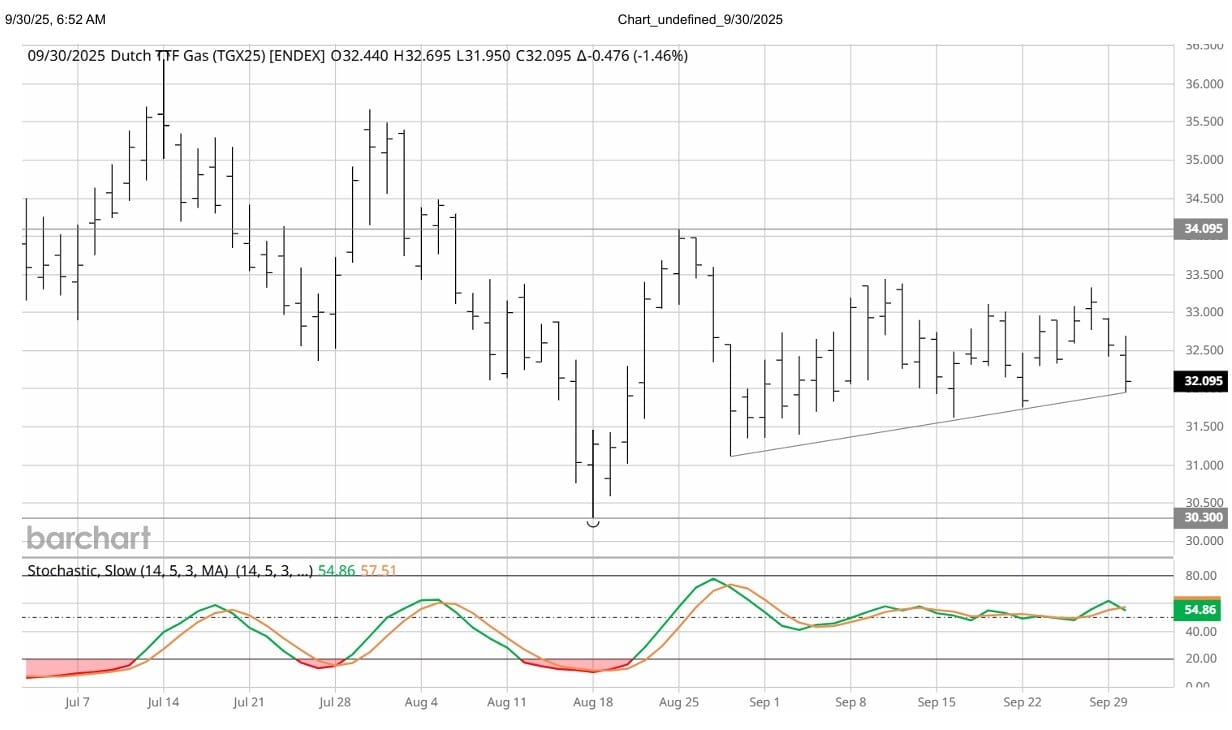
European gas storage was 82.32% full on Sep. 27 compared to the previous five-year average of 89.3% full, according to Gas Infrastructure Europe. ING adds that at this time last year, storage was 94% full. Net injections are back near normal on the day after falling last week. "Weaker Chinese LNG demand is expected to help alleviate supply concerns for Europe as the winter period approaches", as per ING commentary. The technical picture for the TTF on the DC chart has seen momentum turn negative, although the overall price pattern is a sideways one over the month of September. There is a support trendline that intersects today at Euro 32 that is being tested.
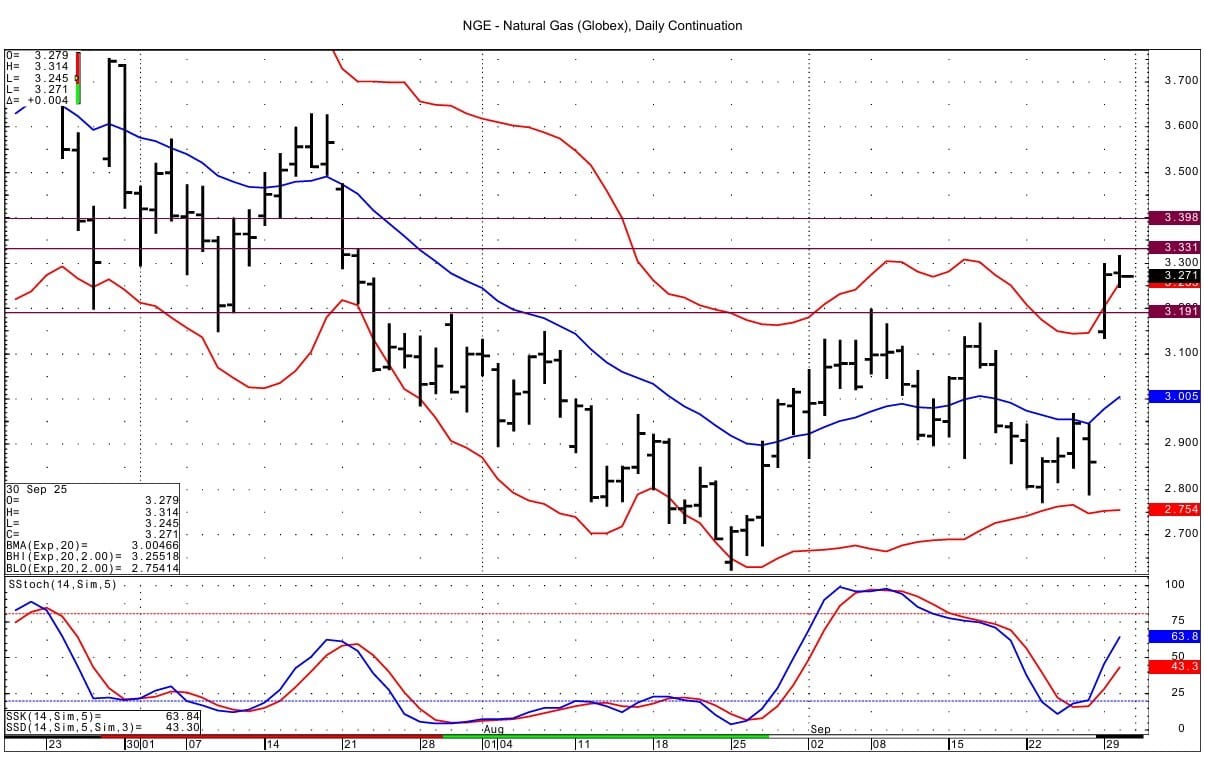
The picture for the NG is seeing the spot futures testing the DC chart's upper bollinger band again today. That band lies at 3.255. Momentum remains positive. Support for the spot Ng futures lies at 3.191-3.199. Resistance lies at 3.331-3.334 and then at 3.398-3.401.
Enjoyed this article?
Subscribe to never miss an issue. Daily updates provide a comprehensive analysis of both the fundamentals and technical factors driving energy markets.

Click below to view our other newsletters on our website:
Disclaimer
This article and its contents are provided for informational purposes only and are not intended as an offer or solicitation for the purchase or sale of any commodity, futures contract, option contract, or other transaction. Although any statements of fact have been obtained from and are based on sources that the Firm believes to be reliable, we do not guarantee their accuracy, and any such information may be incomplete or condensed.
Commodity trading involves risks, and you should fully understand those risks prior to trading. Liquidity Energy LLC and its affiliates assume no liability for the use of any information contained herein. Neither the information nor any opinion expressed shall be construed as an offer to buy or sell any futures or options on futures contracts. Information contained herein was obtained from sources believed to be reliable, but is not guaranteed as to its accuracy. Any opinions expressed herein are subject to change without notice, are that of the individual, and not necessarily the opinion of Liquidity Energy LLC
Reply