- Liquidity Natural Gas Daily
- Posts
- The Seasonal Pattern historically is suggesting that a low may have been established for NG
The Seasonal Pattern historically is suggesting that a low may have been established for NG
Liquidity Energy, LLC
Randall Rothenberg
March 20, 2026
March 20,2026
Overview
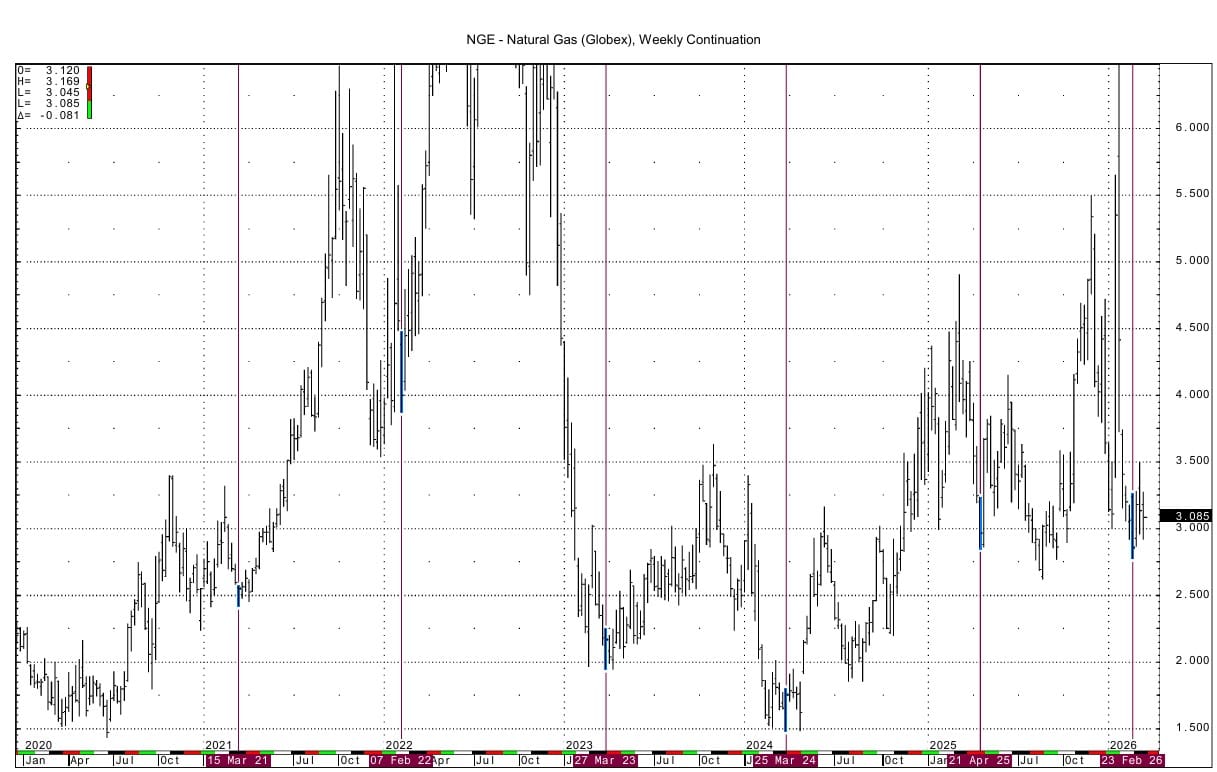
In 4 of the past 5 years, the NG spot futures have made a seasonal low between the week of February 7 and March 27.
This year has seen a low made in the week of February 23. The low was $2.775.
We see NG having a greater chance to rally from here due to its seasonality and due to other factors.
We are coming up on April 1, which is the beginning of injection season in the US for natural gas supplies. This , we believe, will provide some underlying demand for gas.
The recent news of the extensive damage to the massive Qatari LNG facility at Ras Laffan has put a greater spotlight on NG futures pricing, which seems more impacted in its price by the events in the Mideast. The focus has risen on NG feedgas demand in the US as global LNG supply will be reduced due to the damage to the Ras Laffan.
Another supportive element for NG in the coming weeks is the forecast for Texas weather. Texas will experience near-record, summer-like heat with dry conditions through late March 2026, driven by a high-pressure ridge. Highs will reach the mid-80s to low 90s, with elevated fire risks due to low humidity. Early April anticipates warmer-than-usual conditions before shifting towards above-normal rainfall later in the spring. This forecast is courtesy of the Old Farmer's Almanac. Currently, the Southwest and California are seeing record heat. The Western portion of Texas is set to experience record high temperatures in the low 90's. We highlight the weather in Texas as that state has become almost the epicenter for NG demand, especially weather-wise.
Celsius Energy is forecasting the next 4 weeks worth of EIA gas storage data to show a near zero change in the total amount of natural gas stored in tank in the US. But, that would equate to the storage amount versus the 5 year average being reduced by 137 BCF, as per their calculations.
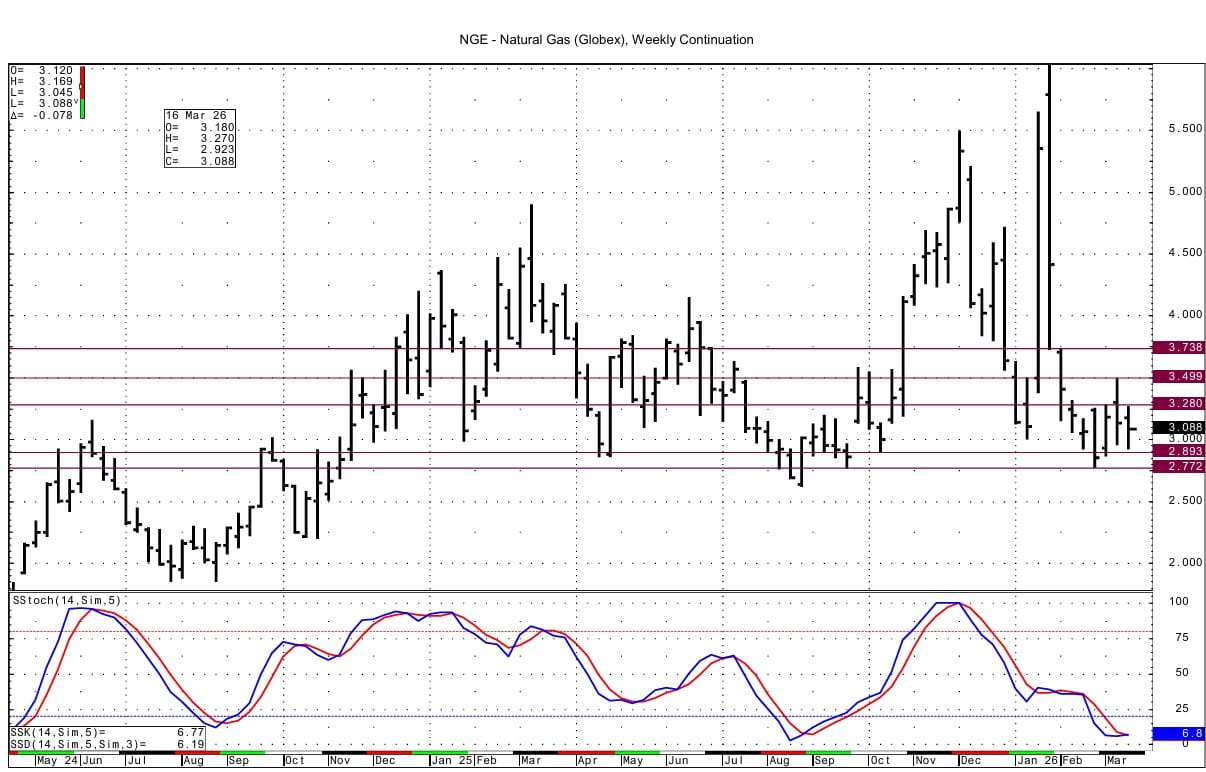
Technically the NG weekly chart is showing momentum that is trying to turn positive as of this week. Support lies at 2.893-2.897 and then at the February low at 2.772-2.775. Upside resistance comes in at 3.270-3.280 and then at 3.494-3.499 and then at $3.736-3.738.
Enjoyed this article?
Subscribe to never miss an issue. Daily updates provide a comprehensive analysis of both the fundamentals and technical factors driving energy markets.

Click below to view our other newsletters on our website:
Disclaimer
This article and its contents are provided for informational purposes only and are not intended as an offer or solicitation for the purchase or sale of any commodity, futures contract, option contract, or other transaction. Although any statements of fact have been obtained from and are based on sources that the Firm believes to be reliable, we do not guarantee their accuracy, and any such information may be incomplete or condensed.
Commodity trading involves risks, and you should fully understand those risks prior to trading. Liquidity Energy LLC and its affiliates assume no liability for the use of any information contained herein. Neither the information nor any opinion expressed shall be construed as an offer to buy or sell any futures or options on futures contracts. Information contained herein was obtained from sources believed to be reliable, but is not guaranteed as to its accuracy. Any opinions expressed herein are subject to change without notice, are that of the individual, and not necessarily the opinion of Liquidity Energy LLC
Reply